🔔 正态分布:钟形曲线与 68-95-99.7 法则🔔 Normal Distribution: the Bell Curve and the 68-95-99.7 Rule
上一片里,小算盘机器人用抽样收回了全校同学的身高表。几千个数字乱糟糟的,可一画成图——形状居然出奇地规整。这是什么?Last leaf, sampling brought the robot the whole school's height table. Thousands of messy numbers — yet plotted, the shape is astonishingly tidy. What is it?
第 1 步:中间多,两头少Step 1: Most in the middle, few at the ends
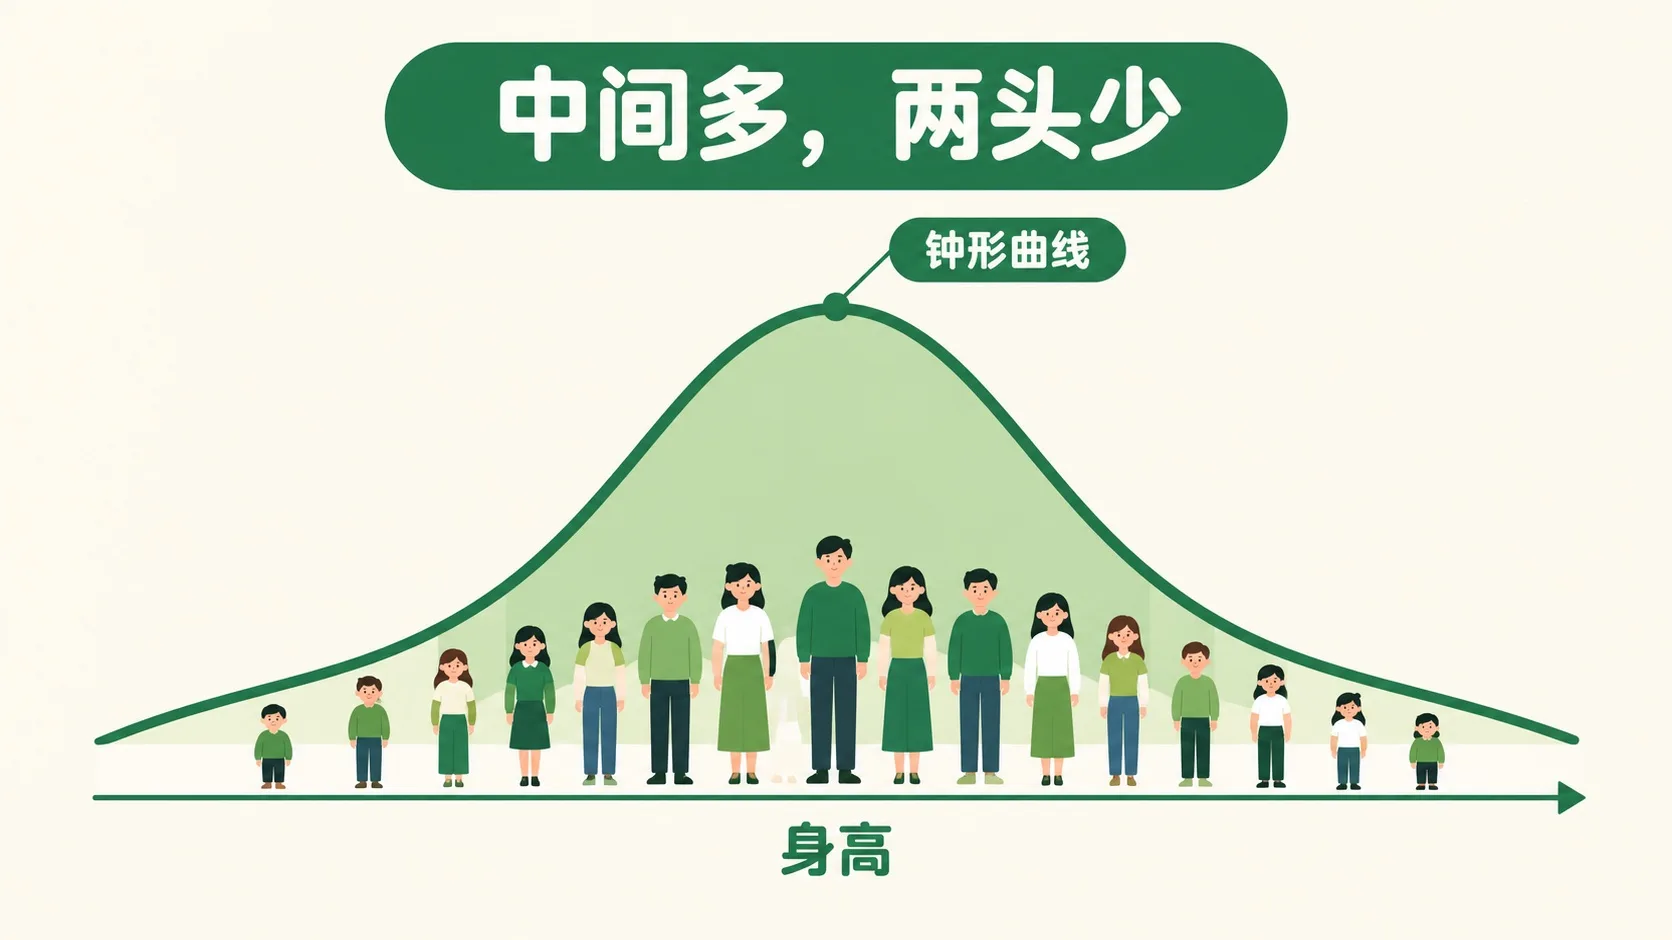
把身高从矮到高排好,数一数每个高度有多少人。Line the heights up from short to tall, and count how many people share each height.
画出来是一条钟形曲线:中间高、两头低。特别矮和特别高的人很少,大多数人挤在中间。身高、考试分数、称量误差……大量真实数据都长这样。最高的位置是均值 μ,它定下曲线的中心。The picture is a bell curve: high in the middle, thin at the ends. Very short and very tall people are rare — most crowd near the centre. Heights, exam scores, weighing errors: a huge amount of real data looks like this. The peak is the mean μ, which fixes the centre.
换一所学校,或者换成考试成绩,这条曲线还会长这样吗?Change the school, or switch to exam scores — does the curve stay the same?
第 2 步:μ 定中心,σ 定胖瘦Step 2: μ sets the centre, σ sets the spread
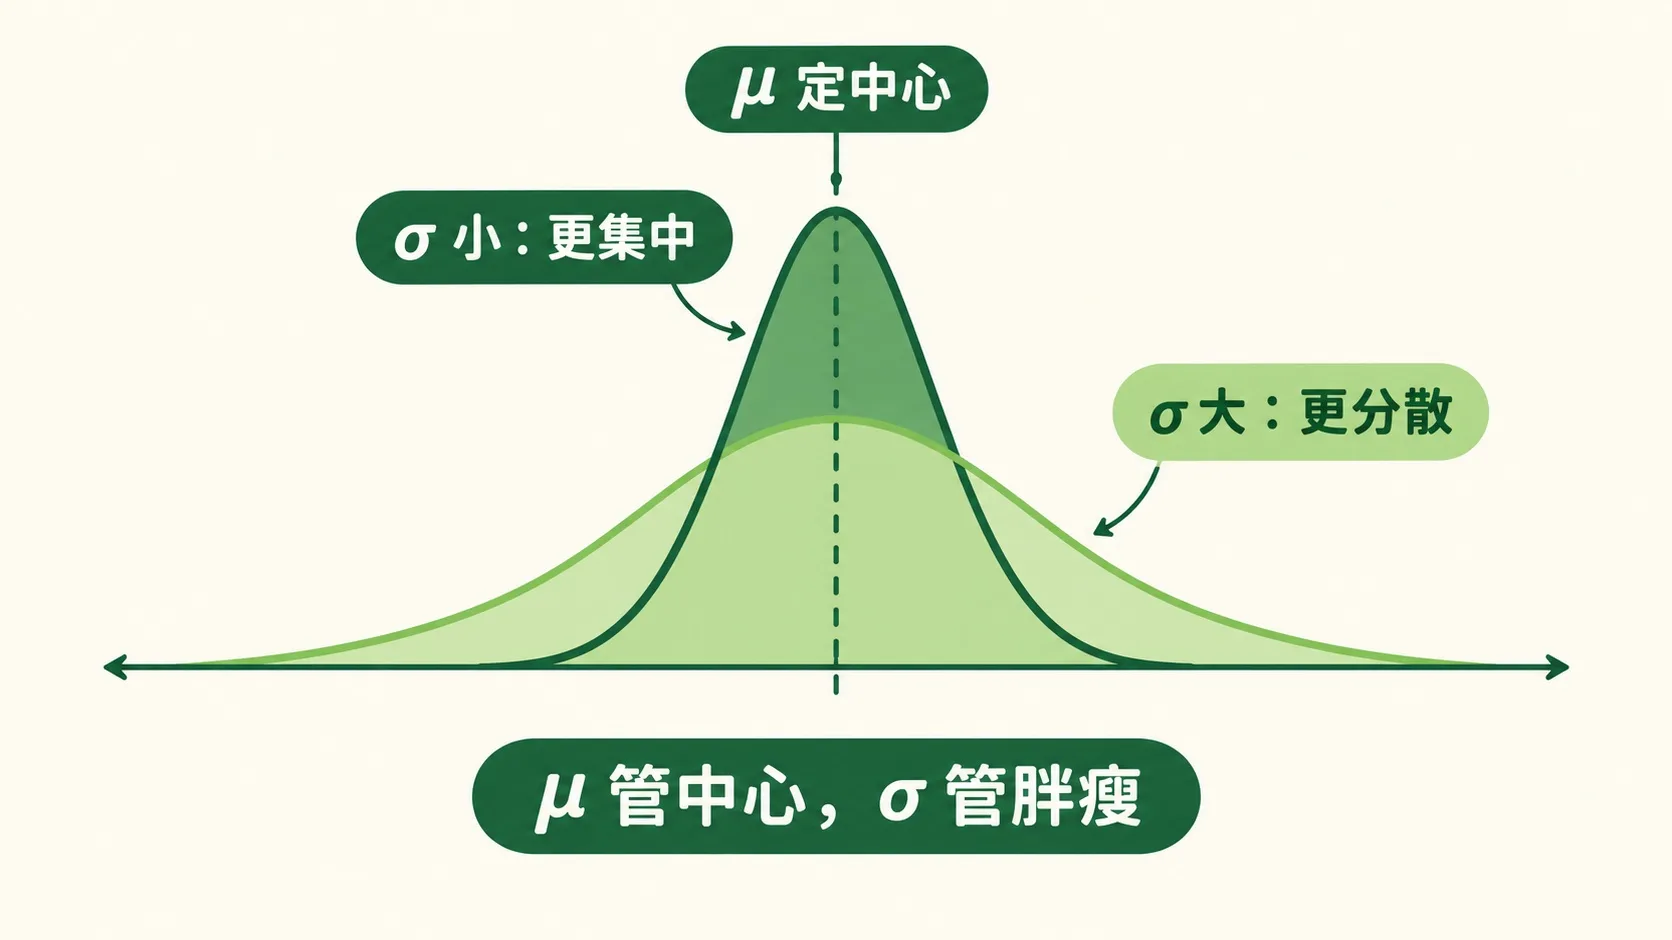
形状不变,位置和胖瘦会变。均值 μ 把曲线左右平移:中心在哪,大多数人就在哪。标准差 σ 管胖瘦:σ 小,数据扎堆、曲线瘦高;σ 大,数据散开、曲线矮胖。一句话:μ 定中心,σ 定胖瘦。The shape stays; the position and width change. μ slides the curve left or right: where the centre is, where most people are. The standard deviation σ sets the width — small σ: tightly packed, tall and narrow; large σ: spread out, short and wide. One line: μ sets the centre, σ sets the spread.
知道了中心和大致的胖瘦,怎么快速判断一个人的位置?Knowing the centre and the spread, how do you place one person quickly?
第 3 步:68-95-99.7 法则Step 3: The 68-95-99.7 rule
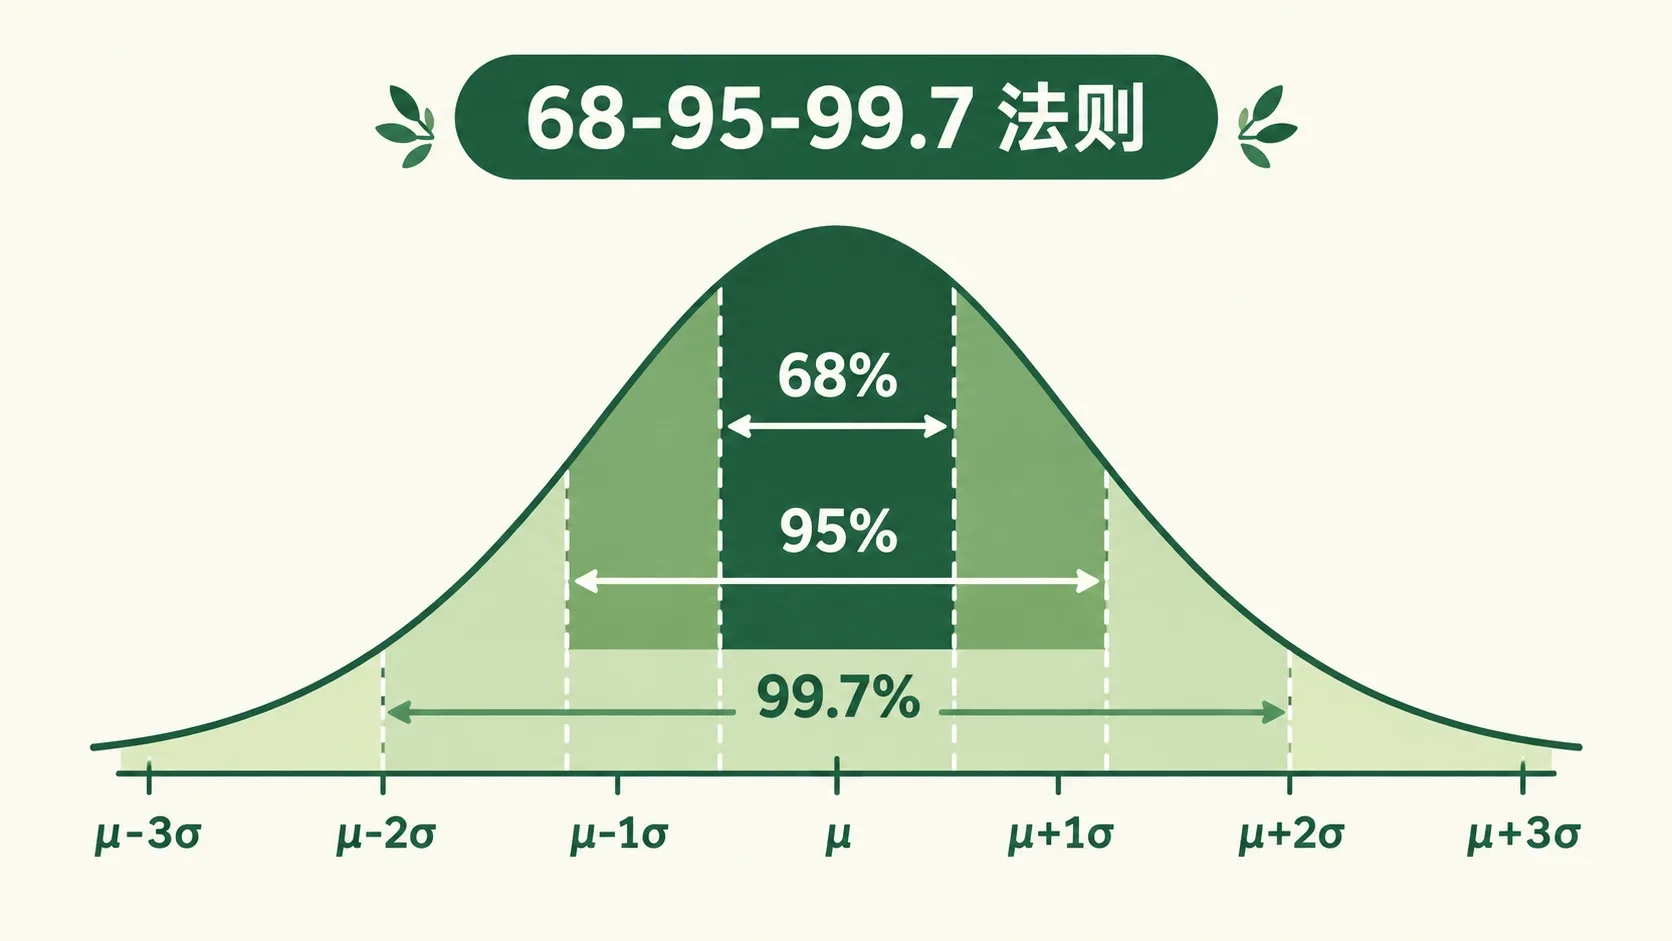
经验法则:约 68% 的数据在 μ±1σ 内,约 95% 在 ±2σ 内,约 99.7% 在 ±3σ 内。例:身高 μ=170cm、σ=6cm,164~176cm 之间约占 68%;高于 188cm 或低于 152cm 的,一千人里约三个。The empirical rule: about 68% of data lies within μ±1σ, about 95% within ±2σ, and about 99.7% within ±3σ. Example: heights with μ=170cm, σ=6cm — about 68% of people fall between 164 and 176cm; beyond 3σ (above 188cm or below 152cm) only about 3 in 1000.
🎮 你来捏曲线(40 秒)🎮 Your turn: shape the bell (40 seconds)
拖滑块把曲线捏成各种形状,看红点落在哪条色带;再闯 4 关,用 |x − μ| ÷ σ 判断落在几倍标准差内。Drag the sliders to reshape the bell and watch which band the dot falls in; then pass 4 tasks using |x − μ| ÷ σ.
一句话记住它:身高、分数、误差大多“中间多、两头少”;μ 定中心、σ 定胖瘦,68-95-99.7 快速定位。Remember it in one line: heights, scores and errors cluster in the middle; μ sets the centre, σ sets the spread, and 68-95-99.7 places any value fast.
钟形曲线:中间高、两头低,最高处是均值 μBell curve: high centre, thin tails, μ at the peakσ 越小越集中;σ 越大越分散Smaller σ = more concentrated; larger σ = more spread out68% 在 ±1σ 内,95% 在 ±2σ 内,99.7% 在 ±3σ 内68% within ±1σ, 95% within ±2σ, 99.7% within ±3σ
内容参考 OpenStax 等公开教材,多来源核对 · AI 生成、人工审核 · 发现错误欢迎指正,帮这片叶子长得更好。Based on OpenStax and other open textbooks, cross-checked across sources · AI-generated, human-reviewed · Spotted a mistake? Tell us — help this leaf grow.
 Back to tree