🌊 方差与标准差:数据有多“散”🌊 Variance & Standard Deviation: how spread out?
上一片我们数出了“出现最多的那个”。可平均数也好、众数也好,它们都只说中心,不告诉你数据是挤在一起,还是散得到处都是。这一片,小算盘机器人去射箭队帮忙选人。Last leaf we counted the value that shows up most. But mean and mode only describe the centre — they say nothing about whether the data huddles together or scatters. This leaf, the little abacus robot helps pick an archery team.
第 1 步:平均一样,稳度不同Step 1: Same average, different steadiness
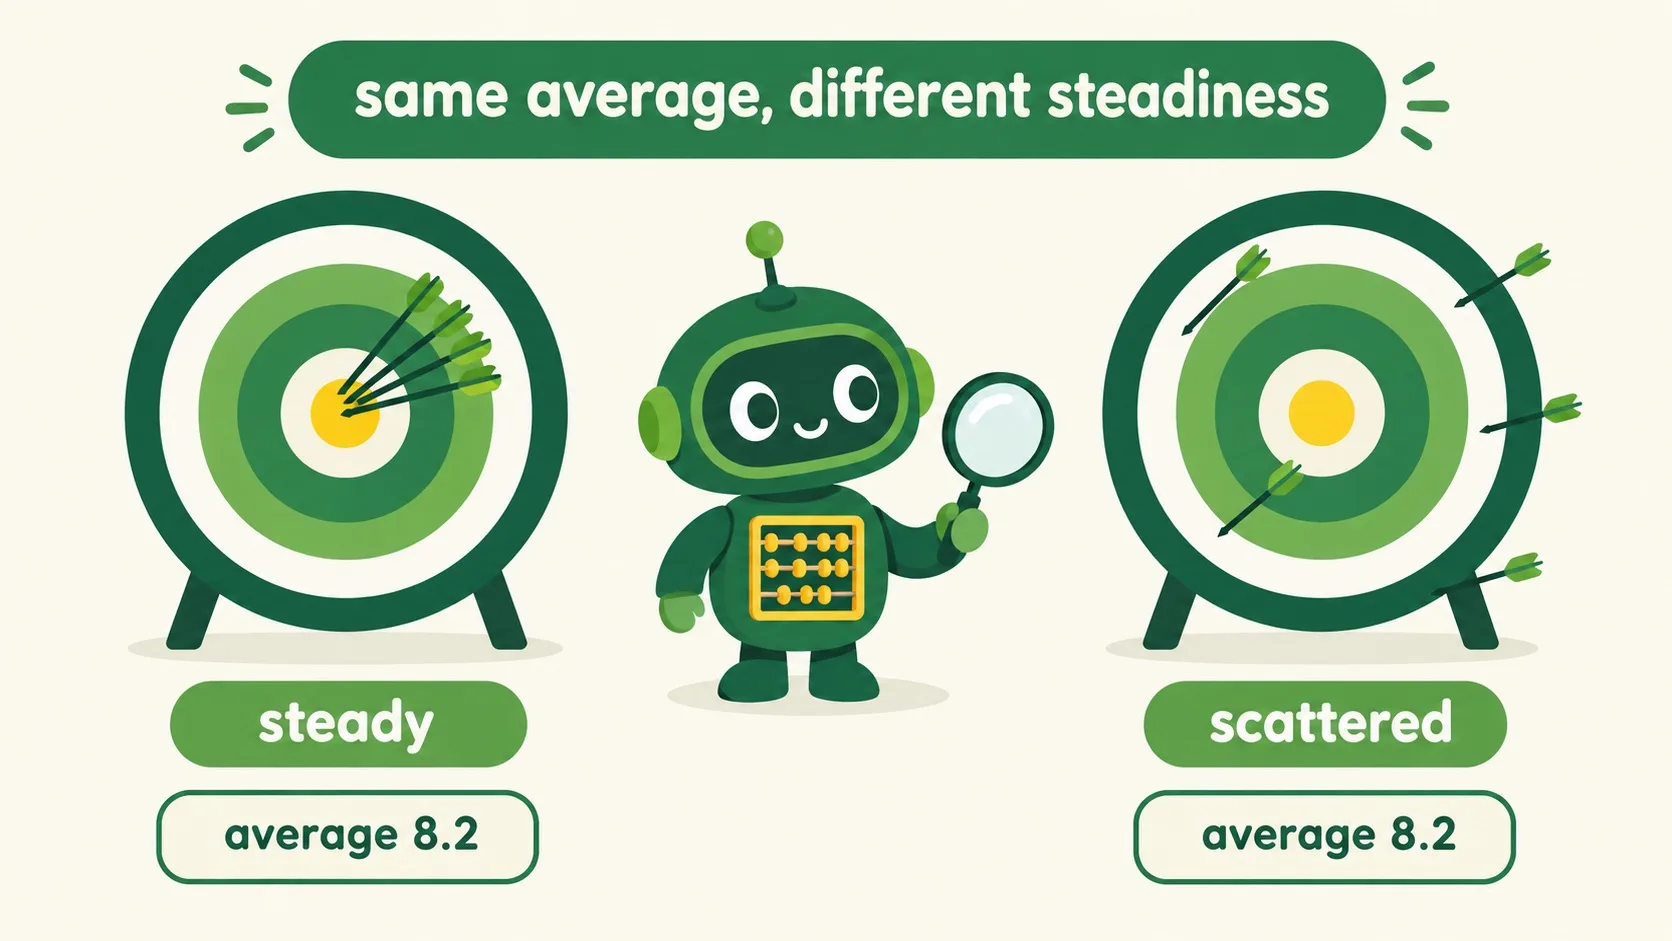
教练犯了难:两位队员的平均环数一模一样。The coach is stuck: two archers average exactly the same score.
左边队员的箭都扎在靶心附近;右边队员的箭满靶乱飞。平均环数都是 8.2,可“稳”的程度天差地别。平均数只说中心在哪,不说数据散不散——想选稳的,得看每个数离平均有多远。The left archer’s arrows cluster near the bullseye; the right archer’s arrows are scattered all over the target. Both average 8.2 — yet their steadiness is worlds apart. The mean tells you where the centre is, not how spread out the data is. To pick the steady one, measure how far each value sits from the mean.
“散”是个感觉,怎么把它变成一个数?机器人有主意。“Spread” is a feeling — how do we turn it into a number? The robot has a plan.
第 2 步:给“散”配把尺子:方差Step 2: A ruler for spread: the variance
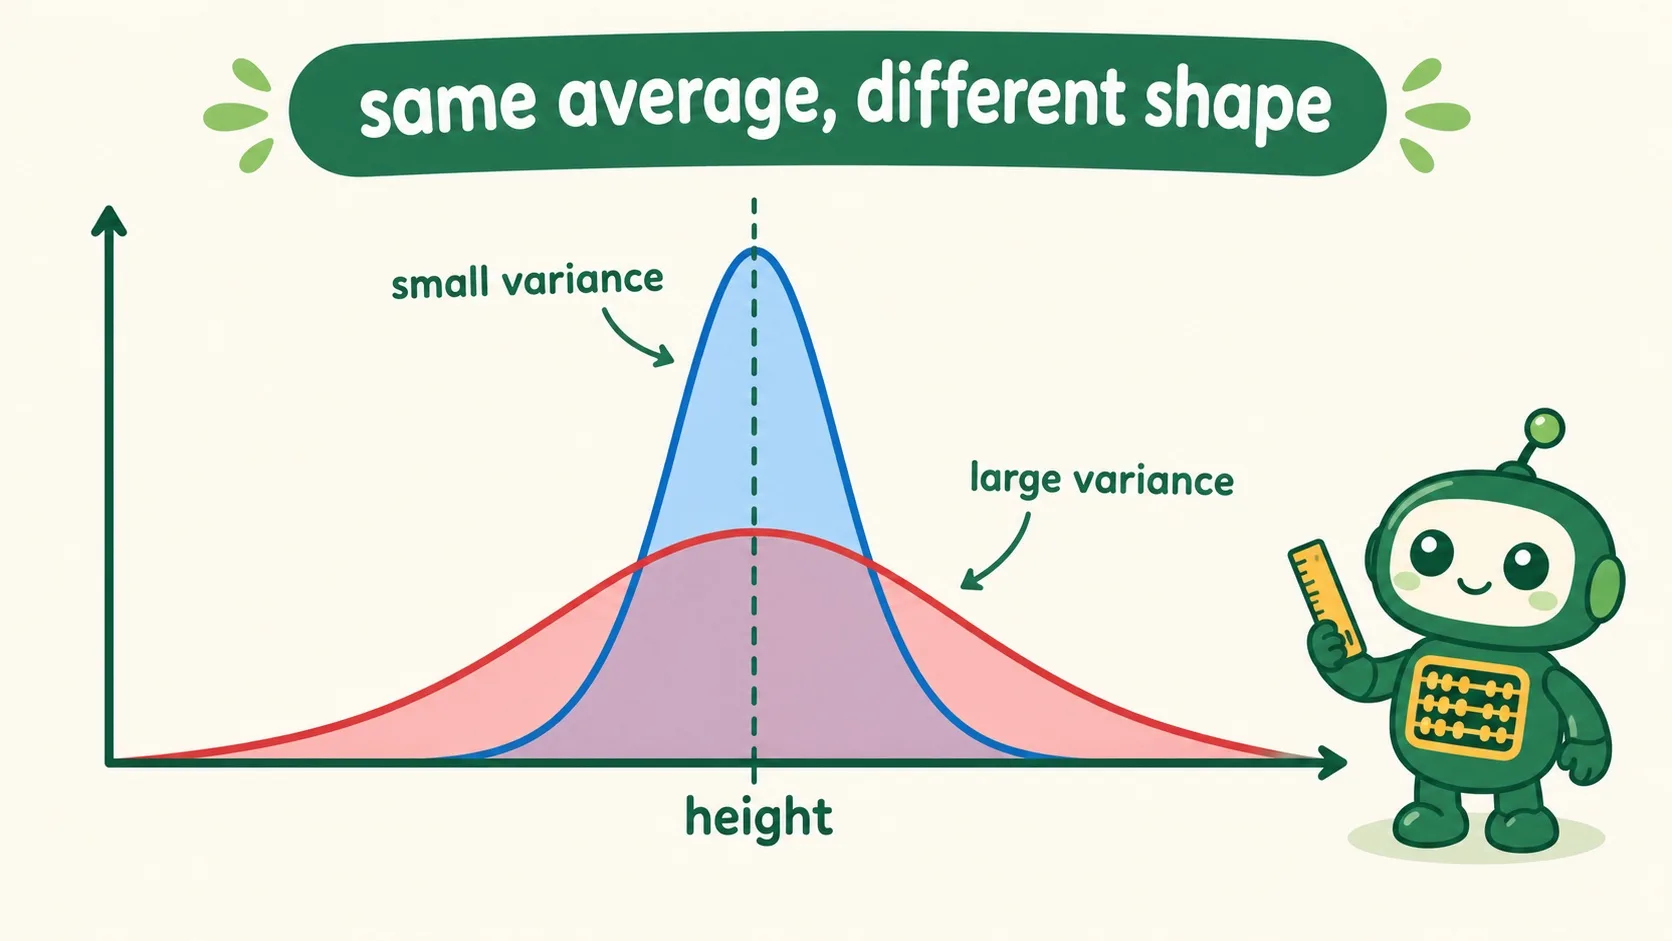
量出每个数到平均数的距离,平方后加起来、再平均——得数叫方差(variance)。把方差开平方根,就是标准差(standard deviation):它和原数据同单位,更好懂。比如 1、2、3、4、5:平均是 3,方差是 2,标准差约 1.41。两条身高曲线平均一样:矮胖的红线方差大、更散;高瘦的蓝线方差小、更稳。Measure each value’s distance from the mean, square the distances, add them up and divide — that’s the variance. Take its square root and you get the standard deviation: same units as the data, easier to read. Take 1, 2, 3, 4, 5: the mean is 3, the variance is 2, the standard deviation about 1.41. The two height curves share a mean: the short plump red one has a larger variance; the tall thin blue one a smaller one.
最后看一眼:标准差在生活里长什么样?One last look: what does it look like in real life?
第 3 步:稳稳落地:硬地板还是弹簧床Step 3: Landing steady: hard floor or trampoline
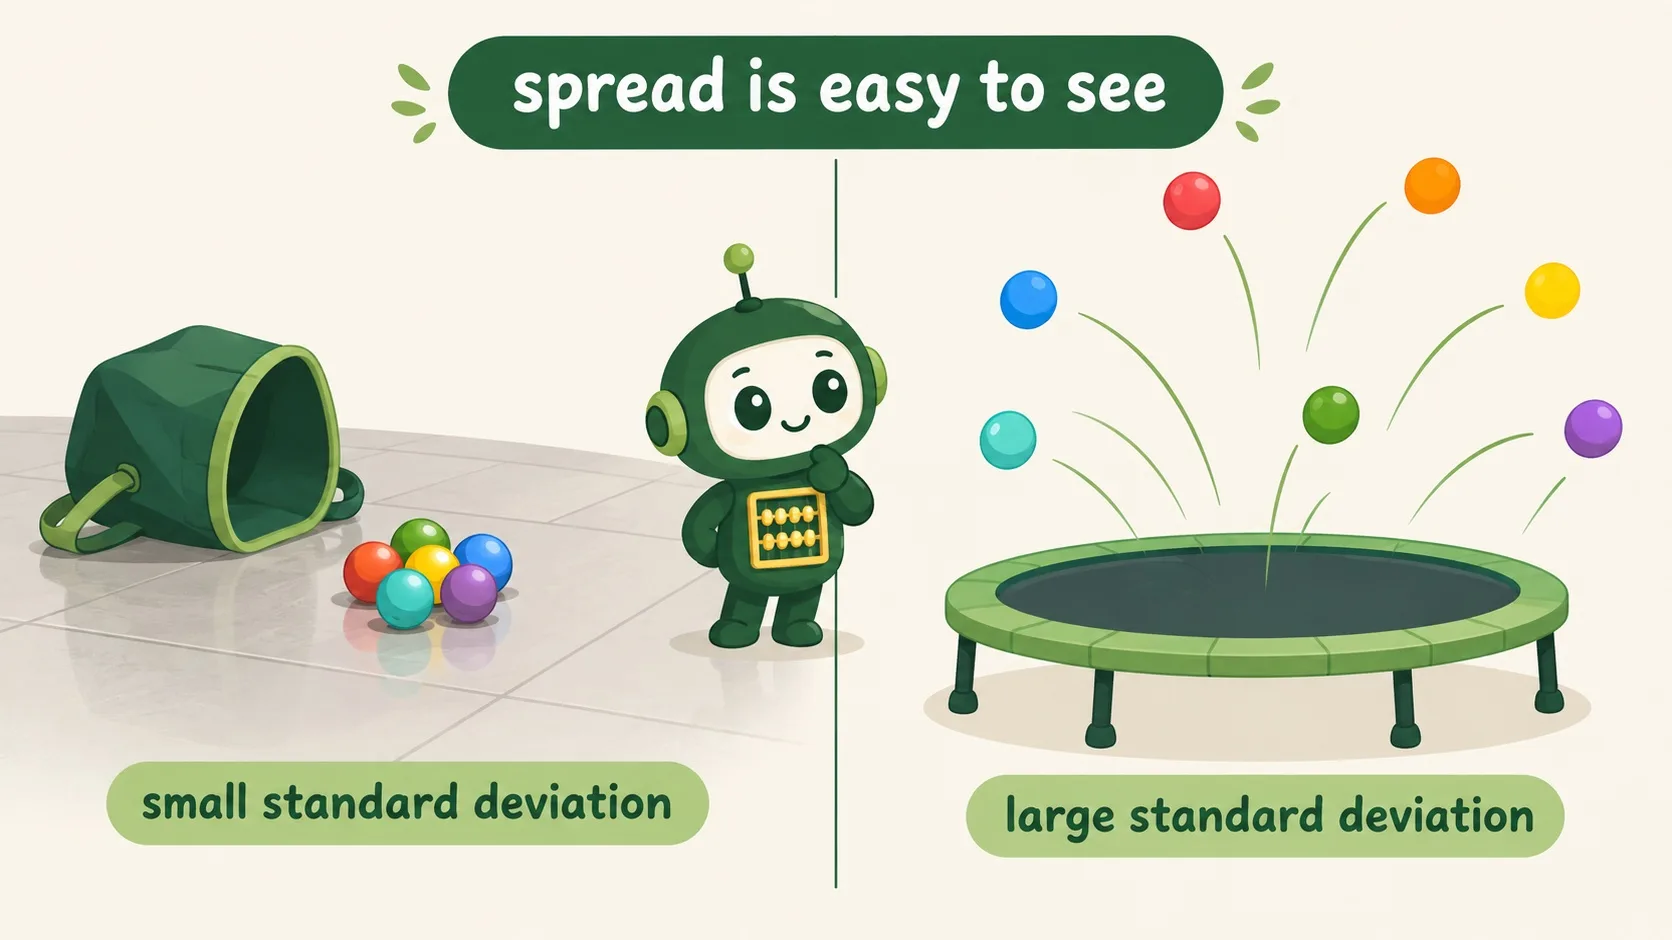
把一袋小球倒在两种地面上:硬地板上,球都堆在落点附近——标准差小;弹簧床上,球被弹得到处乱飞——标准差大。工厂用它挑稳定原料,体检用它看指标波动,考试用它分析成绩稳不稳。散得越小,越可预测。Tip a bag of balls onto two surfaces: on the hard floor they gather near the landing spot — small standard deviation; on the trampoline they bounce everywhere — large standard deviation. Factories use it to pick stable materials, clinics to watch how readings fluctuate, schools to judge score consistency. The smaller the spread, the more predictable things are.
🎮 拖一拖:把数据调“稳”或调“散”(30 秒)🎮 Drag: make it steady — or scattered (30 seconds)
拖动 5 个数据点,方差和标准差实时变化。4 关任务:把“散度”调进目标区间就撒花——试试“更稳”和“更散”分别是什么感觉。Drag the five data points and watch variance and standard deviation change live. Four tasks: land the spread inside each target range. Feel the difference between “steadier” and “more scattered”.
一句话记住它:平均数说中心,方差和标准差说“散”:离差平方的平均是方差,开根号是标准差,和原数据同单位。Remember it in one line: the mean tells the centre; variance and standard deviation tell the spread. Squared distances from the mean, averaged, give the variance; its square root is the standard deviation, in the data’s own units.
方差 = 每个数到平均数的距离,平方后取平均Variance = the average of squared distances from the mean标准差 = √方差,和原数据同单位(身高用厘米、环数用环)Standard deviation = √variance, in the data’s own units散得越小越稳;选队员、挑原料、看波动都用它Smaller spread means steadier — used for picking players, materials, and tracking fluctuations
内容参考 OpenStax 等公开教材,多来源核对 · AI 生成、人工审核 · 发现错误欢迎指正,帮这片叶子长得更好。Based on OpenStax and other open textbooks, cross-checked across sources · AI-generated, human-reviewed · Spotted a mistake? Tell us — help this leaf grow.
 Back to tree