📉 相关与回归:散点里的趋势线📉 Correlation & Regression: the trend line in the dots
上一片里,你用证据给一个说法做了判决;这一片换个问题——两个量一起变化的时候,怎么一眼看出它们是不是一伙的?Last leaf you judged a claim with evidence. This leaf asks something new: when two things change at the same time, how do we see at a glance whether they move as a team?
第 1 步:把数据点撒出来看形状Step 1: Scatter the dots, read the shape
先别急着算。把成对的数据画成点,门道自己会冒出来。No need to compute yet. Draw each data pair as a dot, and the story shows itself.
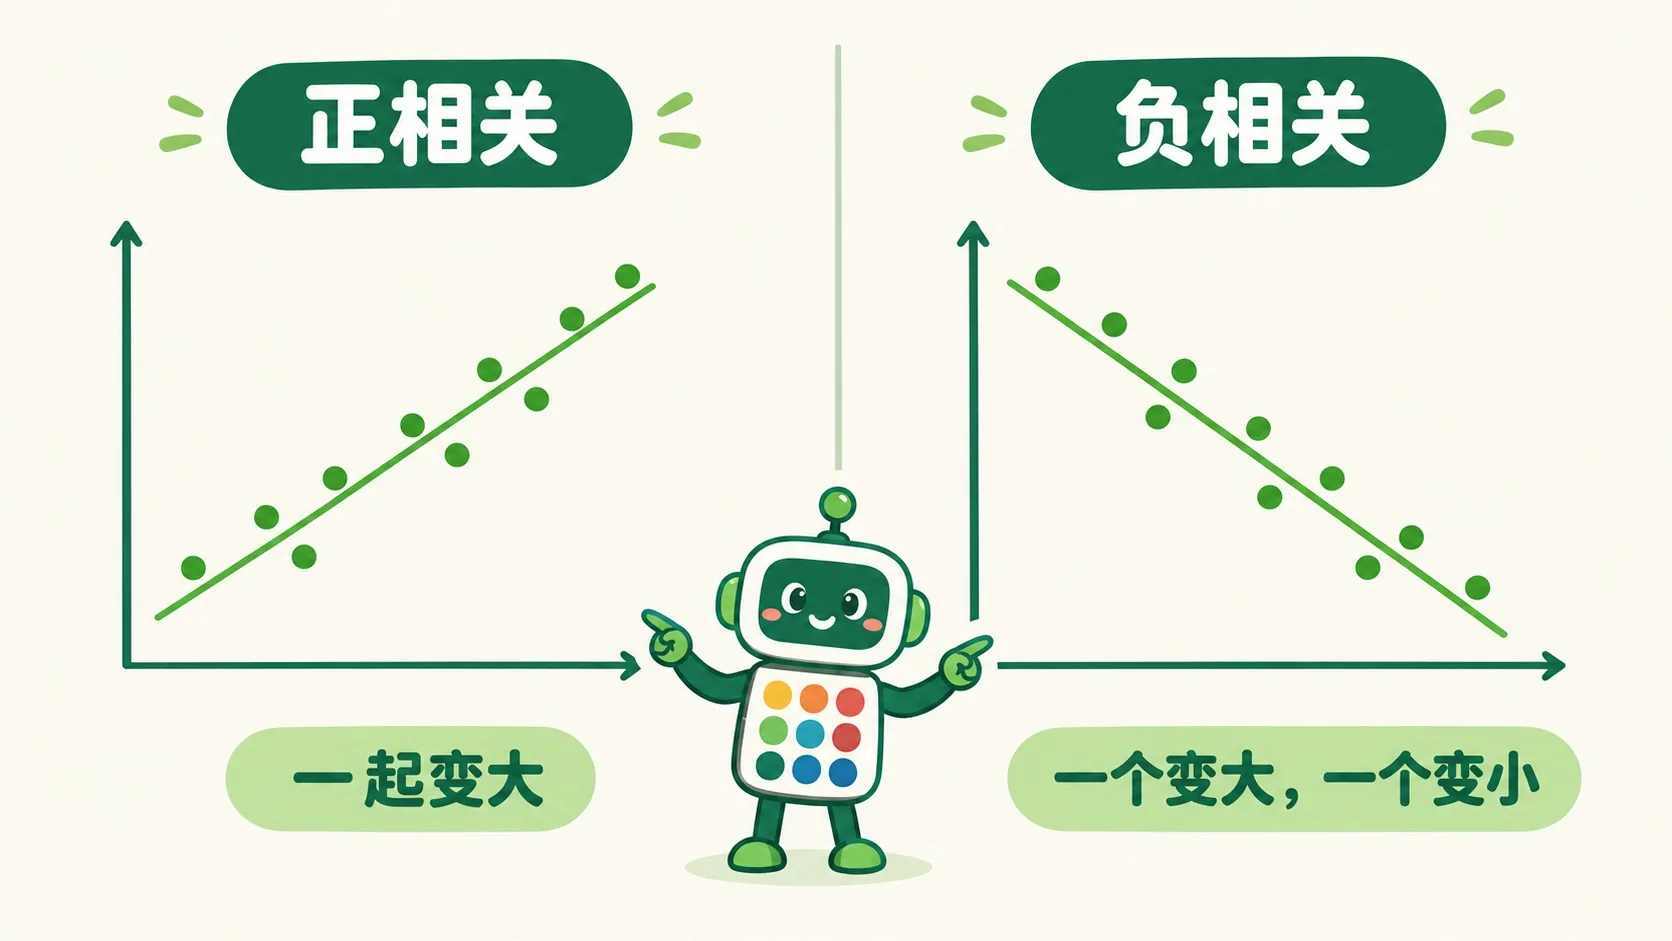
每个点是一对数据:横轴是学习时间,纵轴是考试分数。点整体往右上排,就叫“正相关”。中间那条绿色直线是拟合线——它努力贴近每一个点:点离它越近,关系就越强。这条“最贴近所有点”的线,就是回归线。Each dot is one pair: study time across, exam score up. The dots drift to the upper right, so that is a positive correlation. The green straight line is the fit line — it hugs every point as closely as it can: the closer the dots, the stronger the link. That closest line is the regression line.
那如果点往下走,或者干脆乱成一团呢?What if the dots drift downward — or just form a shapeless mess?
第 2 步:散点图的三张表情Step 2: The three faces of a scatter plot
点往右上、线往上翘:正相关,一个变大另一个也变大。点往右下、线往下压:负相关,一个变大另一个反而变小。还有第三张表情——点撒成一片云,看不出方向,就是“几乎不相关”。方向一眼看,强弱看贴近。Dots rising right with the line tilting up: positive correlation — one grows, so does the other. Dots falling right with the line tilting down: negative correlation — one grows, the other shrinks. And a third face: a shapeless cloud with no clear direction, meaning little or no correlation. Direction is seen at a glance; strength is how tightly dots hug the line.
看起来“一起动”的两个量,一定是谁带动谁吗?If two things move together, does one of them drive the other?
第 3 步:相关不等于因果Step 3: Correlation is not causation
冰淇淋卖得好的日子,游泳的人也多——两个量一起涨,可它们谁也没带动谁。真正的幕后推手是天气:天一热,买冰淇淋和去游泳的人同时变多。相关只说明“一起动”,不说明“谁造成谁”。On days when ice cream sells well, more people swim — both rise together, yet neither drives the other. The hidden hand is the weather: a hot day pushes ice cream sales and swimmers up at the same time. Correlation says “moving together”, not “one causes the other”.
🎮 你来拖一拖(1 分钟)🎮 Your turn: drag the dots (1 minute)
光看不过瘾。下面 7 个点归你管:拖一拖,让拟合线往上翘、往下压、拆成云、再拉成一条线。Watching is not enough. Seven dots are yours to command: drag them to tilt the fit line up, press it down, scatter them into a cloud, then line them up.
一句话记住它:散点图看方向,回归线找“最贴近”;相关只说明一起动,不等于因果。Remember it in one line: a scatter plot shows direction, the regression line is the closest fit — and correlation means moving together, not causing each other.
正相关往上、负相关往下、乱成一团云=几乎没关系Positive goes up, negative goes down, a shapeless cloud means barely any link回归线是“最贴近所有点”的那条直线,点越贴近关系越强The regression line is the straight line closest to all points — the tighter the dots, the stronger the link相关 ≠ 因果:背后可能藏着第三因素,比如天气Correlation ≠ causation: a hidden third factor, like hot weather, may drive both
内容参考 OpenStax 等公开教材,多来源核对 · AI 生成、人工审核 · 发现错误欢迎指正,帮这片叶子长得更好。Based on OpenStax and other open textbooks, cross-checked across sources · AI-generated, human-reviewed · Spotted a mistake? Tell us — help this leaf grow.
 Back to tree