📈 函数图像:把规则画成一条线📈 Function Graphs: Draw the Rule as a Line
上一片说清了:定义域是所有能输入的 x,值域是所有能输出的 y,函数就是"每个 x 只配一个 y"的规则。可是规则看不见摸不着——这一片把它搬上坐标纸,画成一条线。Last leaf we saw the domain is every x you can feed in, the range is every y that comes out, and a function is a rule pairing each x with exactly one y. But a rule is invisible — this leaf puts it on grid paper and draws it as a line.
第 1 步:一个点,就是一次记录Step 1: One point = one record
规则是"输入 x、输出 y",可怎么把它"画"出来?先记点。A rule takes an x and gives back a y — but how do you draw it? Start by recording points.
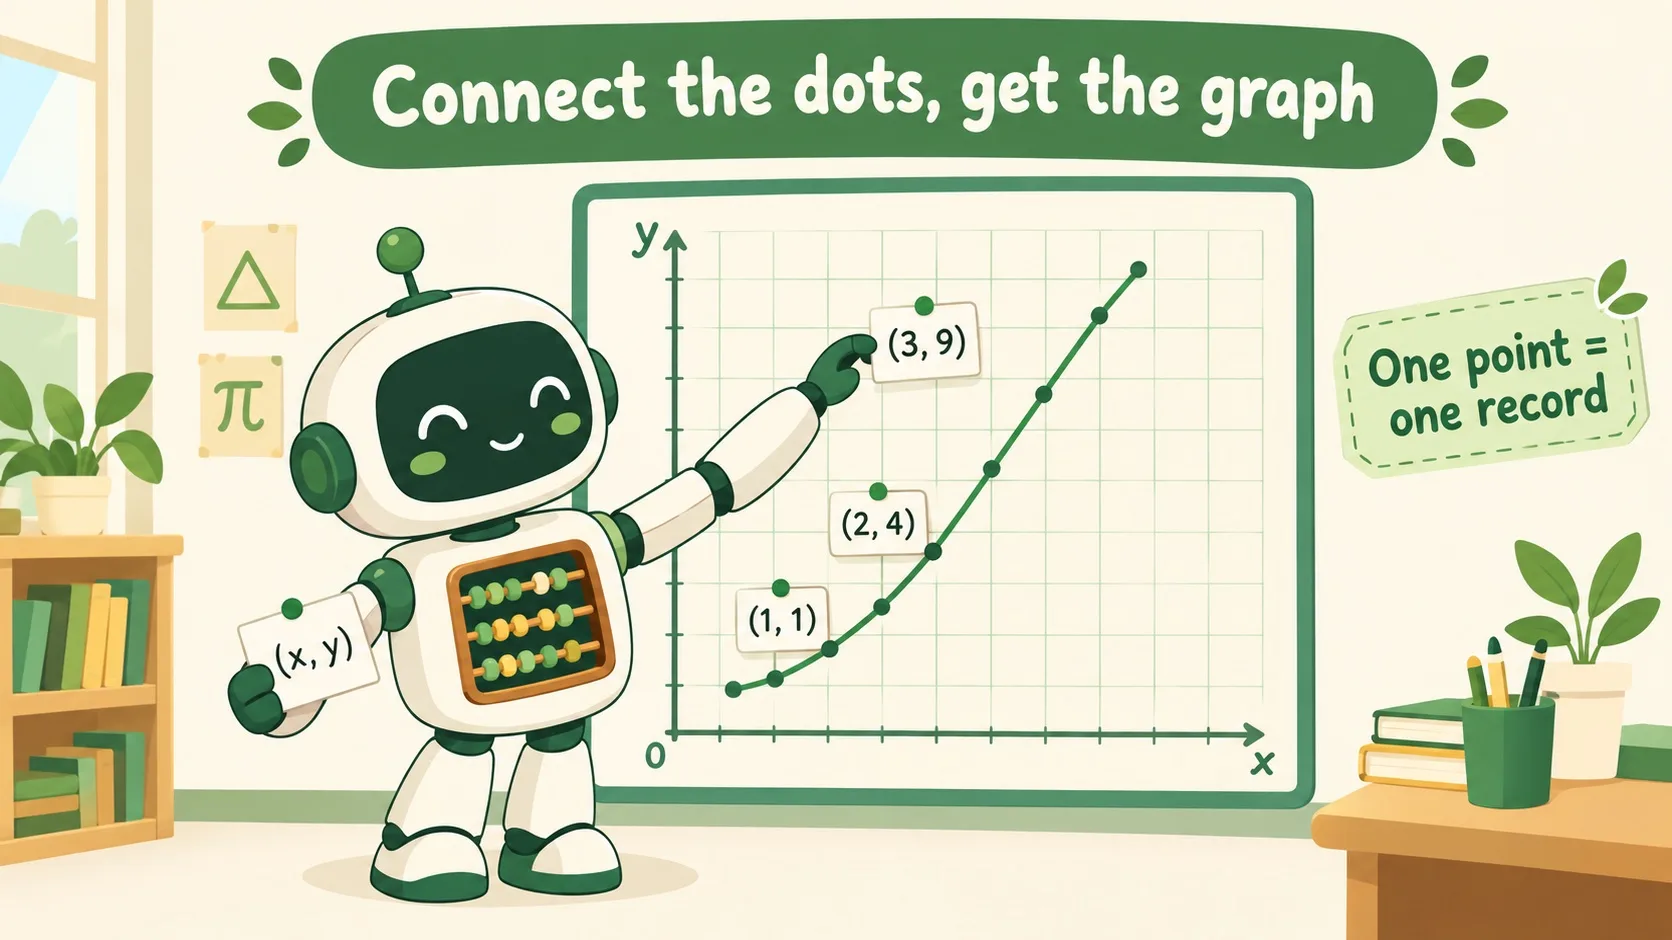
机器人的做法很老实:送进一个 x,算出对应的 y,把这一对 (x, y) 按位置钉到坐标纸上。一个点就是一次记录,像给规则拍了一张快照——(1, 1)、(2, 4)、(3, 9) 各是一个瞬间。The robot's method is honest: feed in an x, work out the matching y, and pin that pair (x, y) at its spot on the grid. One point is one record — a snapshot of the rule: (1, 1), (2, 4), (3, 9).
可一个点孤零零的,能看出什么名堂?But a single lonely point — what does that tell you?
第 2 步:点一个个投出来,连起来才是全貌Step 2: Plot point after point — joined up, they show the whole picture
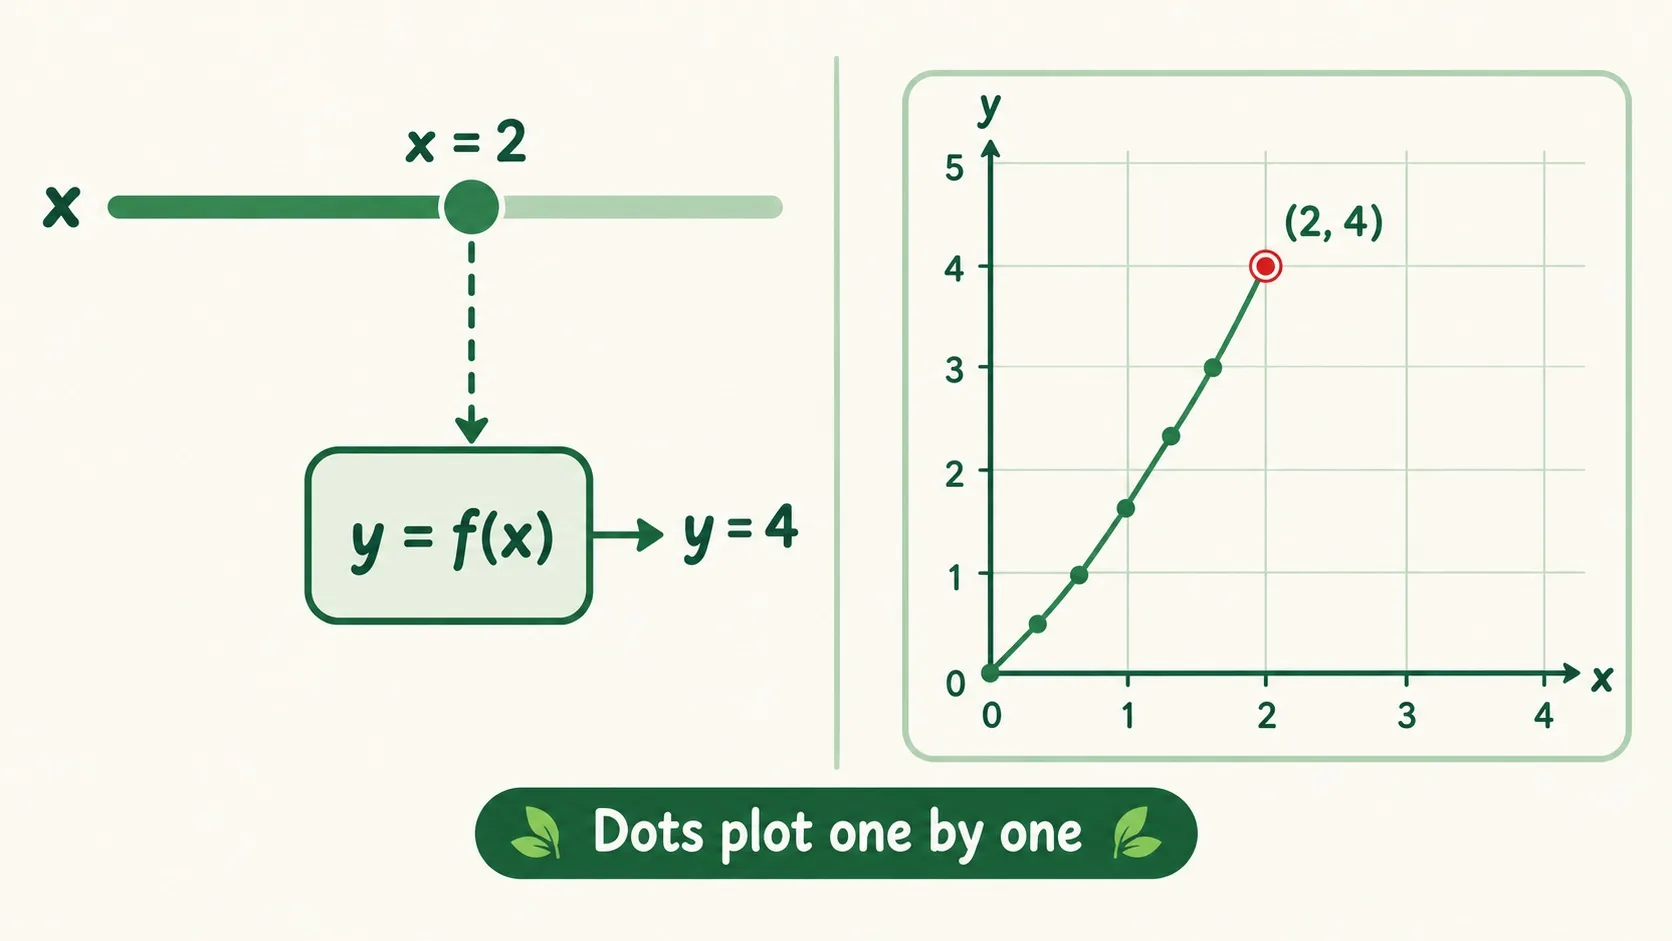
让 x 从小到大扫一遍:滑块停在 x=2,就把点 (2, 4) 投下来。点越记越多,趋势就浮出来了——把点连起来,得到的那条线就是函数图像。点记得越密,画得越准。Sweep x from small to large: stop the slider at x=2 and the point (2, 4) is plotted. The more points you record, the clearer the trend — and joining them gives the graph. Denser points, truer line.
那费劲画出的这条线,到底方便在哪?So what is a hard-drawn line actually good for?
第 3 步:图像一眼看懂趋势Step 3: A graph shows the trend at a glance
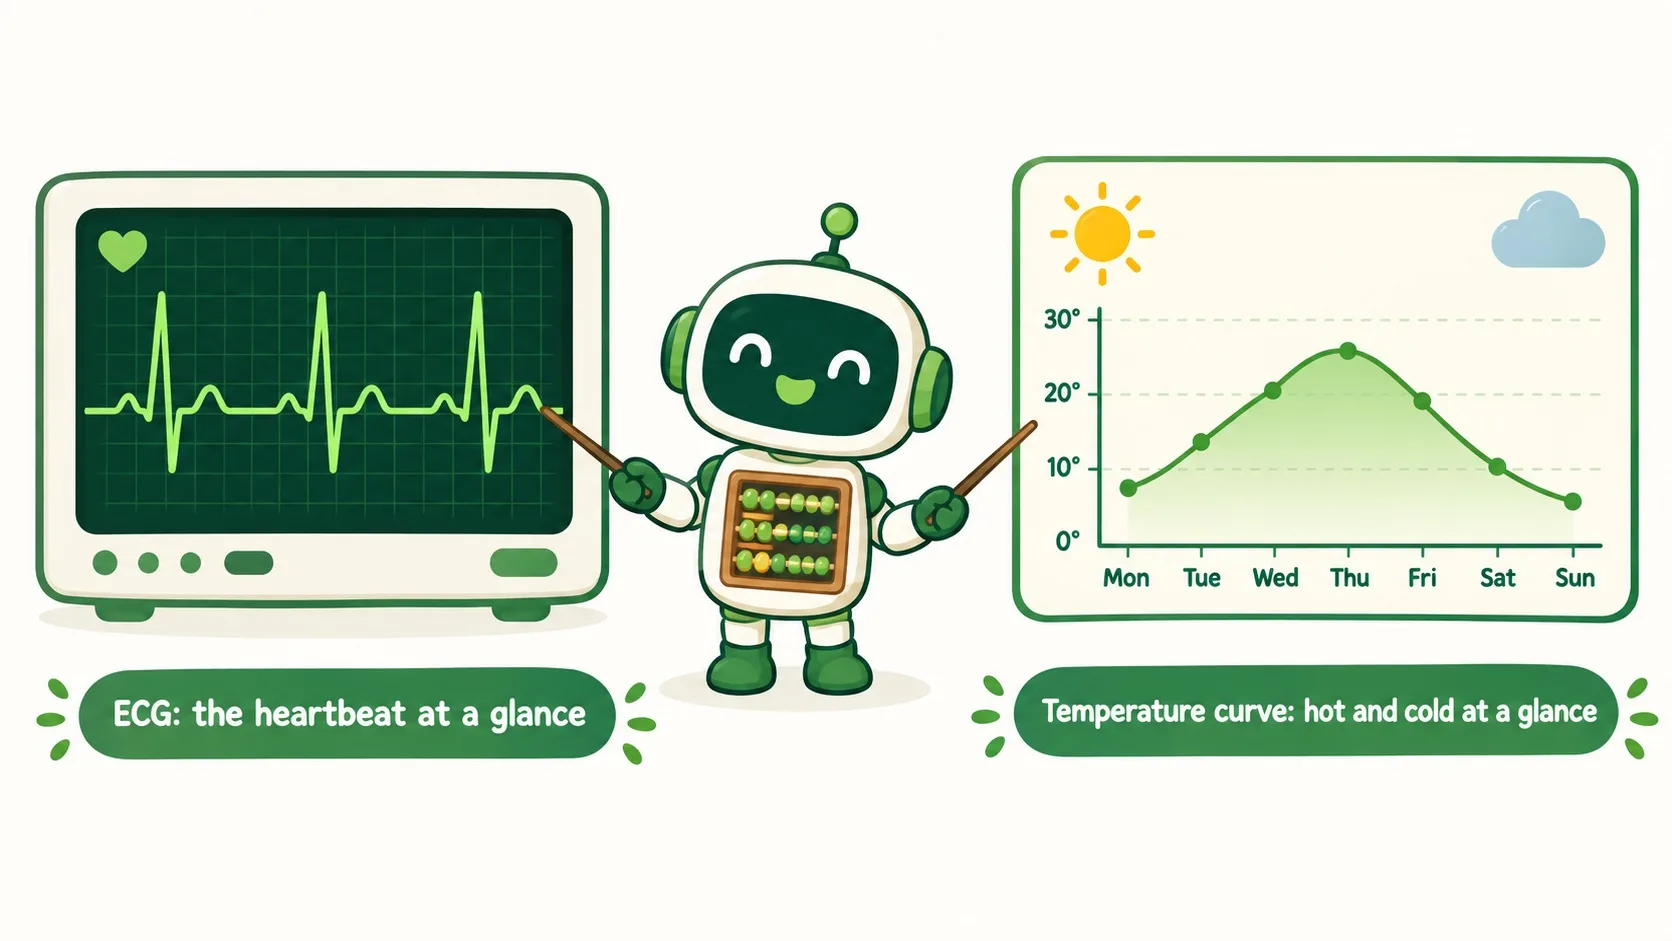
公式告诉你"怎么算",图像直接告诉你"长什么样":心电图一眼看出心跳节奏,气温曲线一眼看出冷暖变化。看图像先看三件事:上升还是下降、哪里最高最低、弯得急不急。A formula tells you how to compute; a graph shows you how it looks: an ECG reveals the heartbeat's rhythm at a glance, a temperature curve the hot and cold spells. Read a graph by three things: rising or falling, where the highs and lows are, and how sharply it bends.
🎮 你来当绘图员(30 秒)🎮 Your turn: run the plotter (30 seconds)
道理讲完了。拖动 x 滑块,替机器人把 3 条曲线一格格投点画出来——画完一条自动换下一条。Theory done. Drag the x slider and plot 3 curves point by point — finish one and the next appears.
一句话记住它:函数图像 = 把所有 (x, y) 记录点连起来的线——点记全了,形状自然浮出来。Remember it in one line: a function graph is all its (x, y) records joined up — record enough points and the shape appears.
点 = 一次记录:一个 x 配一个 y,钉成一个点,如 (2, 4)A point is one record: one x with its y, as in (2, 4)点连成线:x 扫一遍,趋势浮出来,连起来就是图像Join the dots: sweep x, the trend emerges, and the line is the graph看图看趋势:上升/下降、最高/最低、弯得急不急,一眼就懂Read the trend: rising or falling, highs and lows, sharp or gentle — at a glance
内容参考 OpenStax 等公开教材,多来源核对 · AI 生成、人工审核 · 发现错误欢迎指正,帮这片叶子长得更好。Based on OpenStax and other open textbooks, cross-checked across sources · AI-generated, human-reviewed · Spotted a mistake? Tell us — help this leaf grow.
 Back to tree